Time Resolved Mechanical Spectroscopy(TRMS)
There was a great need for developing novel methods for
the rheological study of materials which undergo change with time.
Examples for such mutating materials are polymers during gelation,
phase transition, decomposition, polymerization, etc. These
materials have very interesting properties and, hence, their
commercial utilization have become more and more common in recent
years. To realize this need for engineering data on mutating
materials, we have developed a time-resolved rheometry technique (see below). The novel method has been implemented with the TRMS program which
analyzes dynamic mechanical data as measured on mutating materials.
Time-resolved rheometry greatly differs from classical rheology where
a stable sample is considered to be the prerequisite for a meaningful
rheological experiment.
In time-resolved rheometry, cyclic frequency sweeps sequentially
probe the sample at several different frequencies during the entire
mutation process. Since every data point is taken at a different
state of the material, an elaborate data analysis is necessary.
This is provided by TRMS which is a sophisticated and convenient
(easy-to-use) way to analyze this type of data and thereby enables
the rheologist to attack these kinds of problems without having to
deal with a cumbersome data treatment. The incorporated features
are:
TRMS has been typically applied to complex polymeric
materials
|
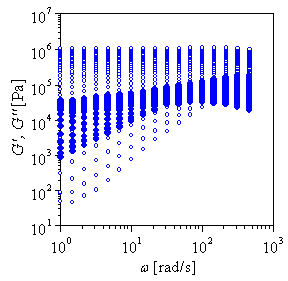
Figure: Time-Resolved Mechanical Spectoscopy : a sequence of frequency sweeps generates G',G" data of a crosslinking polybutadiene |
Sequence of Steps during Data Processing with TRMS
Data Sorting The cyclic frequency sweep (CFS) data as
generated by the rheological experiment is written into a single
(and therefore long) file as shown in the figure above. In order to organize and further analyze
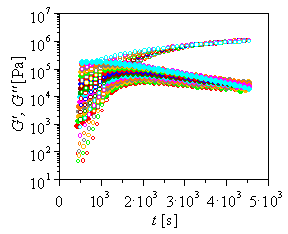
this data, it becomes necessary to sort and split this file into
several new files, each of which contains only data measured at a
single frequency. These files are similar to those one would get by
performing several time sweeps at different frequencies. The
inherent advantage of the CFS technique is that only one sample is
used and hence, all the "time sweeps" (which in this case were
created by sorting the data) are performed on the same sample under
the same external conditions.
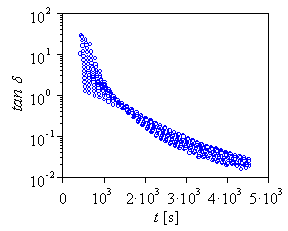
Figure:
Finding the gel point as tan
Data Smoothing In order to be able to interpolate at any time, it is necessary to fit a curve to the data sets at every frequency. This puts the data into the functional form that is required for the interpolation. A smoothing procedure is integrated to avoid carrying along the scatter that might exist in the data. The smoothed data will then be stored and subsequently used in the interpolation procedure.
|
Figure: Sorting the data and generating time-dependent G',G" plots at constant frequency. |
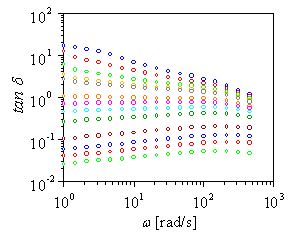
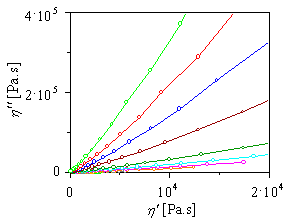
Data Interpolation Viscoelastic material functions as a function of frequency are important to characterize the different material states. However, such functions cannot be measured directly on a changing sample because every data point represents a different state of the material and, consequently, a frequency sweep would probe different material states. Interpolation of CFS data makes it possible to calculate such frequency-dependent functions. The smoothed data is used to evaluate viscoelastic functions at certain user-specified times within the experimental time window for every probed frequency. The program evaluates the dynamic mechanical material functions.
|
Figure: tan delta plots for increasing extent of crosslinking |
|
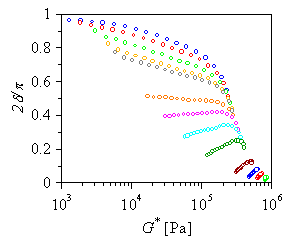
Figure: Cole-Cole plot for increasing extent of crosslinking (same data as above) |
Mutation Limit The method of CFS and TRMS analysis described above can be applied as long as the material changes are sufficiently slow, i.e. the material behaves in a quasi-stable manner during a single measurement (time to take one data point). This condition can be quantified by means of the mutation. The mutation number should stay below 0.15 for reasonable data to be taken. The validity of the quasi-stability assumption can be verified a from the data analysis.
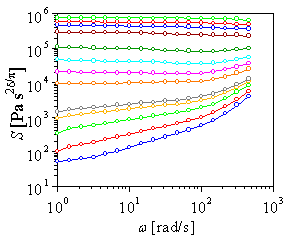
Plot Utility The powerful IRIS graphics interface is included to allow for professional presentation of all measured and calculated data. A variety of printers and plotters can be used. Additional Features Especially for Gelation Experiments The gel stiffness, S, is a property of the critical gel (a material at the threshold of liquid-to-solid behavior). Values of S are calculated as a function of frequency along with the interpolation process. At the gel point, S is independent of frequency. However, for an entangled polymer, the CFS frequency window might include a part of the entanglement zone. The characteristic power-law behavior is valid only in the terminal relaxation region.
|
Figure: Stiffness of polymer at increasing extent of crosslinking (same data as above) |
In summary, TRMS combines easy-to-use analysis and convenient presentation features for rheological data on changing samples and therefore enables the investigation of such interesting and promising materials.
|
Figure: Booij-Palmen plot for polymer at increasing extent of crosslinking (same data as above) |
References
Mours M, Winter HH (1994) Time-Resolved Rheometry. Rheol Acta 33:385-397Mours M, Winter HH (1995) Viscoelasticity During Heating/Cooling Scans. Ind Eng Chem Res 34:3217-3222
