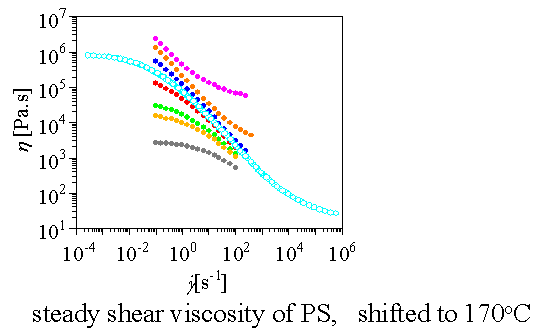
Steady Shear Viscosity
Fitting of Steady Shear Functions (Viscosity)
Experimental data (viscosity) get entered into IRIS in the same way as G',G" data.
Time-temperature superposition (as shown in the above figure) is common practice for extending the shear rate range of the experimental data.
While automated shifting is provided, we recommend manual shifting, at least in the beginning of a study.
You can automatically fit the viscosity data to a collection of the most common functions: power law viscosity, Cross viscosity function, Carreau viscosity function, Carreau-Yasuda viscosity function, etc. The quality of the fit may be evaluated by direct observation in the graph (or by statistical means after data export). After that, generate a table of fit parameters for your further use.
Exploring the Steady Shear Functions (Viscosity)
Altenatively, you may assign values to the rheological parameters of any of the above viscosity models and explore the results graphically.
Exploring the Yield Stress
Yield stress models are also available. You can plot Bingham, Casson, Hershel Bulkley. Parameters can be clicked up or down to move the stress-strain curves or the viscosity curves and to change the shape of these curves. These yield stress models can be shown simultaneously with experimental data and can be shifted onto the experimental data.
